The Racial Wealth Gap & Unemployment Rates
Return to all topics
wealth gap- local
Disparities between Whites and non Whites: Maine is among the whitest states in the nation. While Greater Portland has experienced an unprecedented momentum of growth since 2009, not everyone has benefited from this positive outcome for the city.In 2018, it was reported that 60.4% of the non-white community lived 185% under the federal poverty level compared to the 28.7% of the white community. Within the non-white community, 74.5% of those in the Black community were in poverty, along with 55.5% of the Latinx community (Thrive 2027 Data Dashboard).
Children in poverty by race and ethnicity (5 yr ACS) in Maine: In 2017, 53.2% of Black or African American Mainers were in poverty compared to 14.5% of their white counterpart.
Earnings Disparities by Sex, Race, and Ethnicity: In Maine, Black workers earn on average $0.78 for every $1 earned by a white worker. This disparity grows even more when broken down by gender, with Black women earning even less.
wealth gap- national
Racial and ethnic wealth disparities persist: Families of color will soon make up a majority of the population, but most continue to fall behind whites in building wealth. In 1963, the average wealth of white families was $121,000 higher than the average wealth of nonwhite families. By 2016, the average wealth of white families ($919,000) was over $700,000 higher than the average wealth of black families ($140,000) and of Hispanic families ($192,000).
Put another way, white family wealth was seven times greater than black family wealth and five times greater than Hispanic family wealth in 2016. Despite some fluctuations over the past five decades, this disparity is as high or higher than was in 1963.
Pew Research Center 6 facts about economic inequality in the U.S.: “The black-white income gap in the U.S. has persisted over time. The difference in median household incomes between white and black Americans has grown from about $23,800 in 1970 to roughly $33,000 in 2018 (as measured in 2018 dollars). Median black household income was 61% of median white household income in 2018, up modestly from 56% in 1970 – but down slightly from 63% in 2007, before the Great Recession, according to Current Population Survey data.”
Quantifying America’s Gender Wage Gap by Race/Ethnicity Fact Sheet: the wage gap between men and women in the workplace is an ongoing battle in gender equality. These gaps are even more stark when broken down by race. “Black women are typically paid just 62 cents for every dollar paid to white, non-Hispanic men. The median annual pay for a Black woman in the United States who holds a full time, year-round job is $38,036, while the median annual pay for a white, non-Hispanic man who holds a full-time, year-round job is $61,576 – a difference of $23,540 per year. If the annual wage gap were eliminated, a typical Black woman working in the United States would have enough money to pay for approximately: More than two and a half additional years of tuition and fees for a four-year public university, or the full cost of tuition and fees for a two-year college; Nearly 31 more months of child care; More than 16 additional months of premiums for employer-based health insurance.
The Black-White Wage Gap Is as Big as It Was in 1950: “The black-white wage gap shrunk substantially from 1950 to 1980, and especially during the 1960s. Civil-rights laws and a decline in legally sanctioned racism most likely played some role. But the main reasons, Mr. Charles said, appear to have been trends that benefited all blue-collar workers, like strong unions and a rising minimum wage. Because black workers were disproportionately in blue-collar jobs, the general rise of incomes for the poor and middle class shrank the racial wage gap.
One law was especially important: the 1966 amendment to the Fair Labor Standards Act. When Congress passed the original law, during the New Deal, it deliberately exempted service and other industries with many black workers from the minimum wage. “Just expanding the minimum wage to those industries,” Ellora Derenoncourt, a University of California, Berkeley, economist, said, “boosted the relative wages of black workers substantially.”
Since 1980, however, the wage gap has increased again, and is now back roughly to where it was in 1950. The same economic forces are at work, only in the opposite direction: The minimum wage has stagnated in some states, unions have shrunk, tax rates on the wealthy have fallen more than they have for anyone else and incomes for the bottom 90 percent — and especially the bottom half — have trailed economic growth. Black workers, again, are disproportionately in these lower-income groups.”
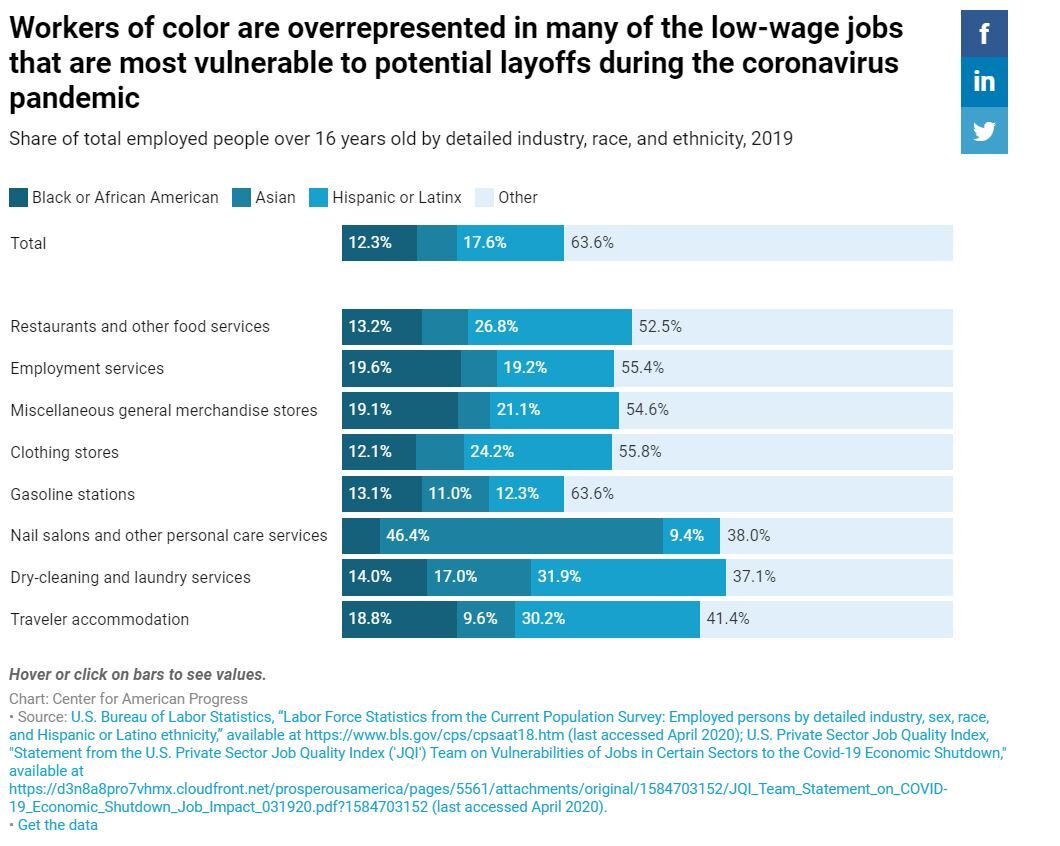
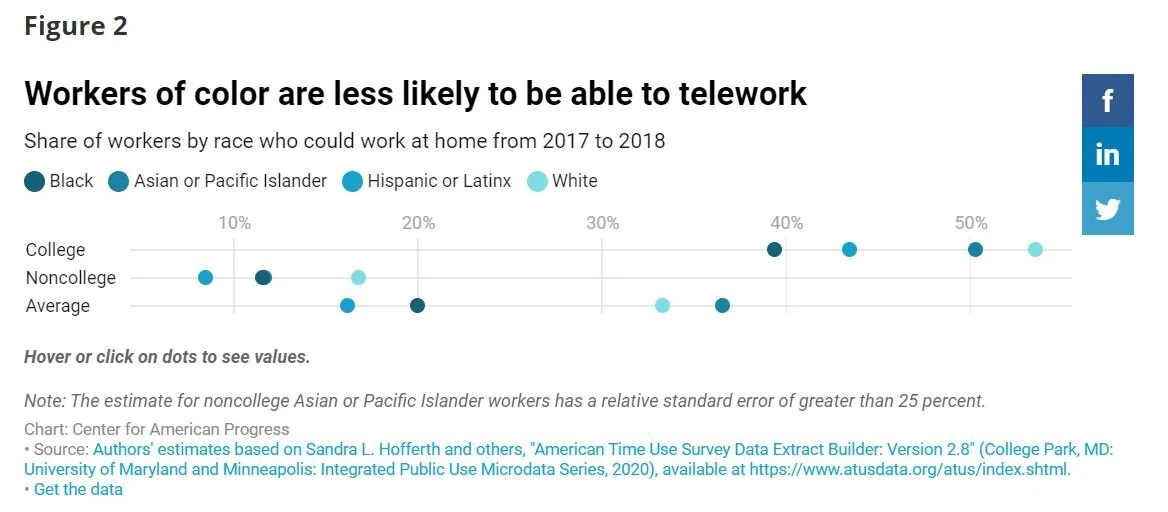
In light of the COVID-19 pandemic, workers of color are less likely to be able to telework.


unemployment-national
State Unemployment by Race & Ethnicity: in nearly state with data reported, Black unemployment is higher than that of its white counterpart.
The Economic Fallout of the Coronavirus for People of Color: “Overall U.S. unemployment peaked at 10 percent during the Great Recession. But it soared even higher in communities of color: 16.8 percent for Black workers, 15.1 percent for American Indian and Alaska Native workers, and 13 percent for Hispanic workers—levels not seen nationally since the Great Depression. Hispanic, Black, and Native American unemployment rates did not reach their pre-recession lows until 2017. Hispanic and Black families also endured the highest rates of foreclosure and lost the most wealth during this period. From 2007 to 2016, Black and Hispanic households lost 48 percent and 36 percent of their wealth, respectively. By contrast, white households lost 24 percent of their wealth during this period. Today, the ratio of median Black and Hispanic household wealth to median white household wealth is just 9.5 percent and 14.6 percent, respectively. Unlike unemployment rates, homeownership and wealth never fully rebounded in these communities.”
Black workers endure persistent racial disparities in employment outcomes: “Black workers are twice as likely to be unemployed as white workers overall (6.4% vs. 3.1%). Even black workers with a college degree are more likely to be unemployed than similarly educated white workers (3.5% vs. 2.2%). When they are employed, black workers with a college or advanced degree are more likely than their white counterparts to be underemployed when it comes to their skill level—almost 40% are in a job that typically does not require a college degree, compared with 31% of white college grads. This relatively high black unemployment and skills-based underemployment suggests that racial discrimination remains a failure of an otherwise tight labor market.”